Ever wondered how to statistically compare two groups when you already know the population standard deviation?
That’s where the two-sample Z-test comes in — especially handy for large datasets.
In this step-by-step guide, we’ll walk through a fully solved numerical example that shows exactly how this test works in practice.
Whether you’re prepping for a stats exam, brushing up on hypothesis testing, or applying it in real-world data analysis, this breakdown will make the concept click — without overwhelming jargon.
Lets start with the problem statement!

Problem Statement:
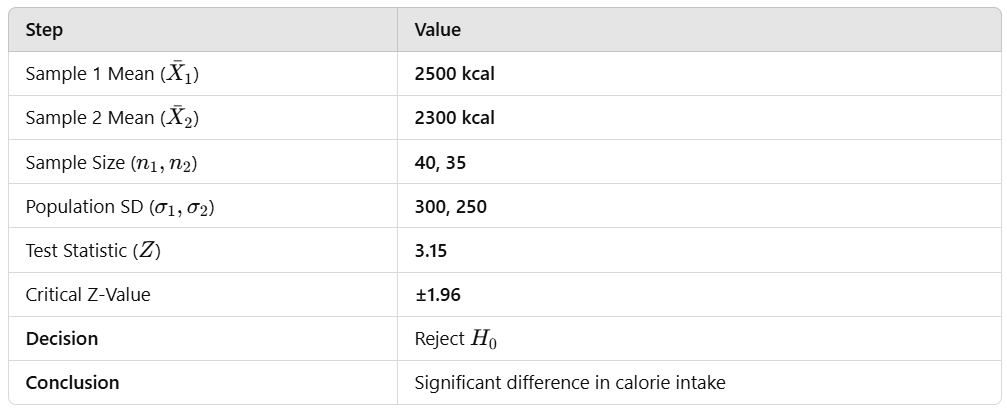
A researcher wants to compare the average daily calorie intake of male and female adults in a city.
Two independent random samples are taken:
- Sample 1 (Males): n1=40, mean X1=2500, population standard deviation σ1=300
- Sample 2 (Females): n2=35, mean X2=2300, population standard deviation σ2=250
At 5% level of significance, test whether there is a significant difference in the mean calorie intake between males and females.
Step 1: Define the Hypotheses
We conduct a two-sample Z-test because:
- Sample sizes are large (n1,n2≥30)
- Population standard deviations (σ1, σ2) are known
- Null Hypothesis (H0): There is no significant difference between the mean calorie intake of males and females. H0:μ1=μ2
- Alternative Hypothesis (H1H_1): There is a significant difference between the mean calorie intake of males and females. H1:μ1≠μ2
This is a two-tailed test.
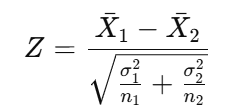
Step 2: Compute the Test Statistic
The Z-test formula for two independent samples is:

Since H0H_0 assumes μ1−μ2=0\mu_1 — \mu_2 = 0, the formula simplifies to:
Substituting the given values:
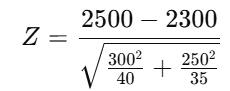
This comes out to be Z = 3.15.
Step 3: Find the Critical Z-Value
For a two-tailed test at 5% significance level (α=0.05\alpha = 0.05), we look up the Z-table:
Zcritical=±1.96
Step 4: Compare and Make Decision
- Calculated Z-value = 3.15
- Critical Z-value = ±1.96
Since ∣Zcalculated∣=3.15 is greater than Zcritical=1.96; we reject the null hypothesis H0.
Step 5: Final Inference
✅ Since the calculated Z-value is greater than the critical Z-value, we reject H0.
✅ There is a statistically significant difference in the mean calorie intake of males and females.
✅ This suggests that gender has an influence on daily calorie consumption.
Summary
Full Python Code to Perform the Z-Test
import numpy as np
import scipy.stats as stats

# Given data
x1, x2 = 2500, 2300  # Sample means
sigma1, sigma2 = 300, 250  # Population standard deviations
n1, n2 = 40, 35  # Sample sizes

# Compute test statistic
z_statistic = (x1 - x2) / np.sqrt((sigma1**2 / n1) + (sigma2**2 / n2))

# Critical z-value for 5% significance level (two-tailed)
z_critical = stats.norm.ppf(1 - 0.025)

# Print results
print(f"Z-Statistic: {z_statistic}")
print(f"Critical Z-Value: {z_critical}")

# Decision
if abs(z_statistic) > z_critical:
    print("Reject the Null Hypothesis (H0): There is a significant difference.")
else:
    print("Fail to Reject the Null Hypothesis (H0): No significant difference.")
Output:
Z-Statistic: 3.1482541868119163
Critical Z-Value: 1.959963984540054
Reject the Null Hypothesis (H0): There is a significant difference.
If you’re as passionate about AI, ML, DS, Strategy and Business Planning as I am, I invite you to:
Connect with me:
- On LinkedIn.
- Career Counselling and Mentorship: Topmate
- Join my Whatsapp Group where I share resources, links, and updates.
Happy Learning!
Comments
Post a Comment