
Phases of data science and analytics

Data Science and analytics isn’t a destination — it’s a journey of continuous learning and application. In my experience, this journey can be divided into five distinct phases:

                                5 Phases of Analytics: Image by Author

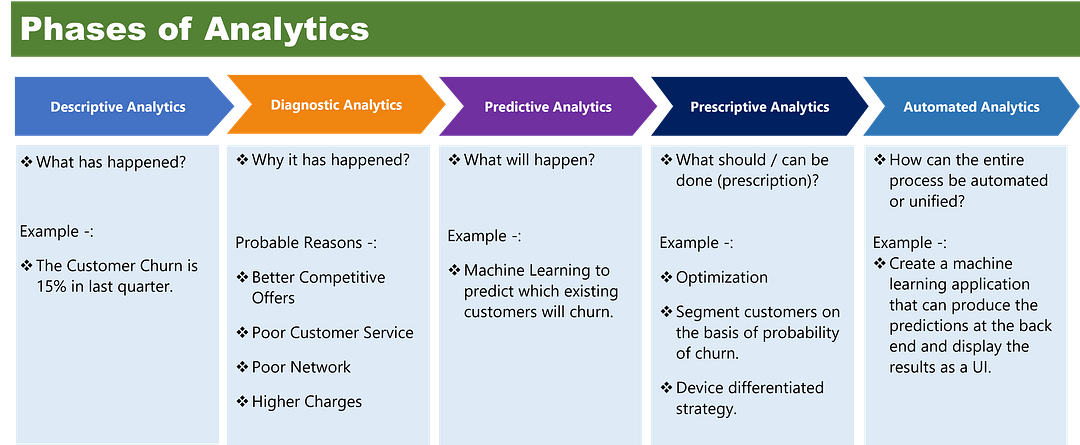
1. Descriptive Analytics: Focused on understanding what happened in the past.

2. Diagnostic Analytics: Answers the critical question: why did it happen?

3. Predictive Analytics: Often seen as the most glamorous phase, it predicts what will happen next.

4. Prescriptive Analytics: Goes a step further to recommend what should be done based on predictions; or how can you optimize business processes or decisions.

5. Automated Analytics: Finally, the ‘product/software’ development stage of analytics. It automates the process — from descriptive to predictive — making analytics accessible and actionable for business stakeholders.

As a data scientist — or as an organization — you need to assess which phase you’re currently in and chart your path forward.

Each phase requires different competencies, and understanding where you want to go can help you focus your efforts and plan strategically.

Remember, the journey never truly ends! 🌟

Which phase of this journey are you currently in? Let me know in the comments section.

Connect with me:

Collection of my other blogs can be found here.

Happy Learning!

Comments

Popular posts from this blog

How to Create Stunning Data Visualizations in Python: Top 10 Techniques to Learn

  A Visual Analytics Journey In this guide, you’re going to learn some of the coolest and most popular visualization techniques, one plot at a time, using the mpg dataset in Python. Whether you’re interested in visualizing univariate (histograms), bivariate (scatter plot) or multivariate (heatmaps) variables, we’ve got it all covered here in this guide. We’ll start by loading the `mpg` dataset from Seaborn, and before you know it, you’ll be the Picasso of Python plots. So lets get going! Dataset First things first, we need to grab the `mpg` dataset. Think of this dataset as a collection of cool cars from the 1970s and 80s. It’s a nostalgic look at how much fuel (miles per gallon) these cars guzzled. import seaborn as sns import pandas as pd # Load the mpg dataset from seaborn mpg = sns.load_dataset( 'mpg' ) # Display the first few rows to get a feel of the data mpg.head() Output: Boom! We’ve got a dataset full of horsepower, cylinders, and other engine-sort-of-things! L...

10 Projects You Can Discuss in Interviews Even If You Don't Have Work Experience

 If you are an aspiring data scientist, you might wonder what kind of projects you can talk about to stand out. The good news is that you don’t need a formal job history to have meaningful projects to discuss. Building and sharing your own projects can demonstrate your understanding of machine learning, AI, analytics, and data handling. This post lists 10 project ideas that you can create and confidently discuss in interviews. These projects cover a range of skills and tools relevant to data science and generative AI. Each project example includes practical tips on how to approach it and what you can highlight during your interview.                Data visualization dashboard created for a personal analytics project 1. Data Cleaning and Exploration Project Start with a raw dataset from sources like Kaggle or UCI Machine Learning Repository. Focus on cleaning the data by handling missing values, removing duplicates, and correcting errors....