Data collection is the foundation of any statistical study, business decision, or research project.
Without reliable data, even the most sophisticated models and strategies fall apart.
Whether you’re building a survey for customer feedback or gathering industry reports, understanding how to collect data properly is essential.
In this guide, we’ll break down:
1.Methods of Collecting Data
2. How to Draft a Questionnaire
3. Sources of Secondary Data
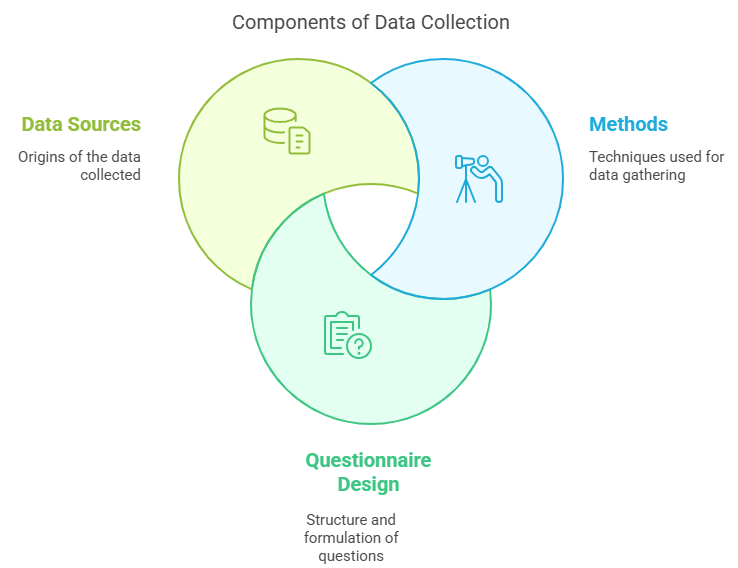
1. Methods of Collecting Data
The methods of data collection are broadly classified into two types:
- Primary Data Collection
- Secondary Data Collection
Primary Data Collection Methods
Primary data is collected first-hand by the researcher for a specific purpose. Here are the common ways to collect primary data:
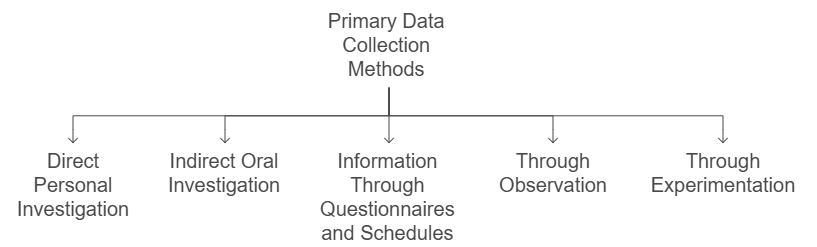
a) Direct Personal Investigation
- Researcher personally collects data by interacting directly with the respondent.
- Highly accurate, but time-consuming and costly.
- Example: A manager interviewing customers at the store.
b) Indirect Oral Investigation
- Information is collected from third parties (not directly from the person concerned).
- Useful when subjects are inaccessible (e.g., prisoners, historical figures).
- Example: Asking locals about the tourism impact in a town.
c) Information Through Questionnaires and Schedules
- Written questions are sent to respondents.
- Suitable for large samples and geographically scattered data.
d) Through Observation
- Data is gathered by observing behavior, actions, or events without directly asking.
- Example: Recording footfall in a shopping mall.
e) Through Experimentation
- Data is collected under controlled conditions.
- Example: Testing how different packaging designs affect product sales.
Secondary Data Collection
Secondary data is data that already exists and was collected for some other purpose.
(We’ll dive deeper into Secondary Data in Section 3.)
2. Drafting a Questionnaire or a Schedule
A poorly drafted questionnaire can destroy your data collection effort. Here’s how to get it right:
Steps to Draft an Effective Questionnaire or Schedule:
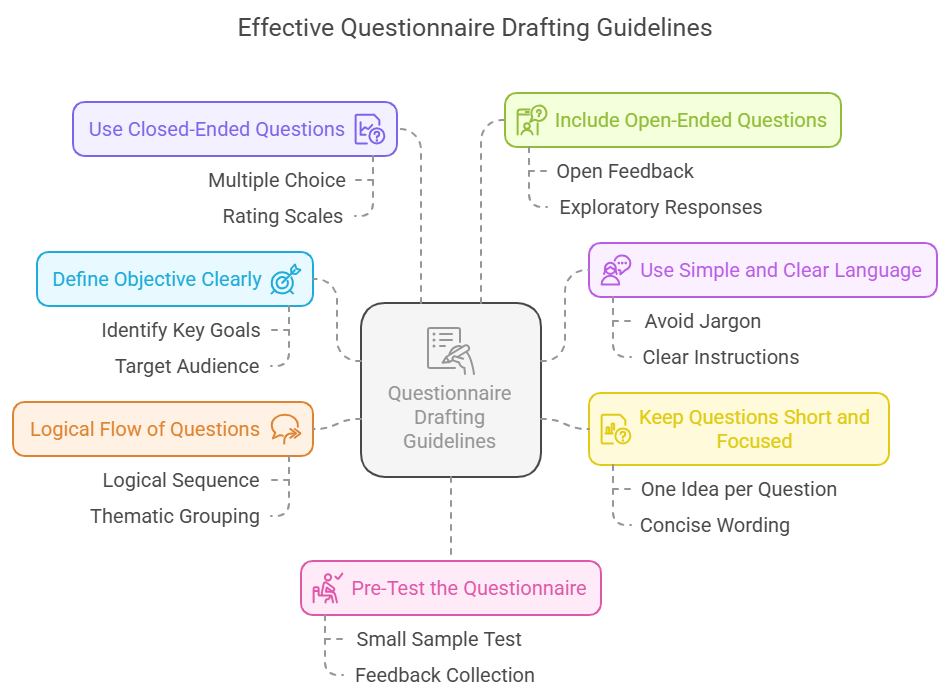
a) Define the Objective Clearly
- What information are you trying to gather?
- Example: “I want to find out why customers cancel subscriptions.”
b) Use Simple and Clear Language
- Avoid jargon, technical terms, and complex sentences.
- Example: Instead of “Evaluate the efficacy of our services,” write “How helpful do you find our services?”
c) Keep Questions Short and Focused
- Long, confusing questions lead to wrong or incomplete answers.
d) Logical Flow of Questions
- Start with easy, non-threatening questions → move to specific or sensitive ones.
e) Use Closed-Ended Questions for Easier Analysis
- Example:
“How satisfied are you with our service?”
🔲 Very Satisfied
🔲 Satisfied
🔲 Neutral
🔲 Dissatisfied
🔲 Very Dissatisfied
(Closed-ended questions = easier to code and analyze.)
f) Include Some Open-Ended Questions Too
- Example: “What suggestions do you have for improving our service?”
g) Pre-Test the Questionnaire (Pilot Survey)
- Test it with a small group before launching it widely.
3. Sources of Secondary Data
Secondary data saves time and effort but needs to be evaluated carefully for relevance and reliability.
Types of Secondary Data Sources:
a) Government Publications
- Census data, economic surveys, labor reports.
- Example: India’s Census Data (available every 10 years).
b) International Organizations
- World Bank, IMF, United Nations, WHO reports.
c) Research Institutions and Universities
- Academic studies, research papers.
d) Company Reports
- Annual reports, financial statements, CSR reports.
e) Trade and Industry Journals
- Business magazines, market research publications.
f) Online Databases
- Google Scholar, Statista, Kaggle datasets.
Checklist Before Using Secondary Data:
- Importance: Why It Matters
- Relevance: Data must match your research objective.
- Accuracy: Source should be reliable.
- Timeliness: Data should be up-to-date.
- Methodology: Understand how the data was collected originally.
Bonus: Important Formula (For Sampling)
If you’re using primary or secondary data from a sample (instead of the full population), here’s a simple formula to determine the required sample size:
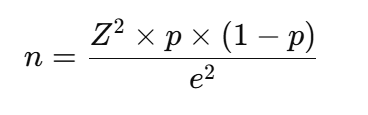
Where:
- n = required sample size
- Z = Z-score (e.g., 1.96 for 95% confidence)
- p = estimated proportion of population (use 0.5 if unknown)
- e = margin of error (e.g., 0.05 for ±5% error)
Example Calculation:
Suppose you want a 95% confidence level, 5% margin of error, and you don’t know the population proportion (assume 0.5).

You would need a sample size of approximately 384 respondents.
Conclusion
Good data collection is the secret sauce behind any successful research or analysis project.
- Use the right method for collecting data based on your goal.
- Draft smart questionnaires to get meaningful answers.
- Choose trustworthy secondary sources when possible.
In a world overflowing with information, those who master the art of data collection will always have the edge.
Connect with me:
- On LinkedIn.
- Career Counselling and Mentorship: Topmate
- Join my Whatsapp Group where I share resources, links, and updates.
Comments
Post a Comment