In the first part of the hypothesis testing interview questions, we discussed about some of the important concepts related to hypothesis testing.
Inferential statistics is a huge domain, and not possible to cover all the topics in one blog. So, in this series, we’ll continue the journey and cover other important concepts.

This blog will walk you through the most important questions and answers about hypothesis testing for different scenarios involving sample sizes and known/unknown population standard deviations.
Ready to ace your interview? Let’s dive in! 🌟
1. What is the Purpose of Testing the Mean in Hypothesis Testing?
Let’s start with the fundamentals!
Question: Why do we perform hypothesis testing on the mean in statistics?
A) To determine if there is a significant difference between the population mean and a sample mean
B) To find the variance of the data
C) To establish a causal relationship between two variables
D) To calculate the median of the dataset
Answer: A) To determine if there is a significant difference between the population mean and a sample mean
Explanation: Hypothesis testing on the mean helps us decide if there is enough evidence to suggest that the sample mean significantly differs from the population mean. This is crucial in many scientific and business decisions where understanding if a process has changed is important.
2. When Do You Use a Z-Test for One Sample Mean?
Know your sample size and population SD!
Question: When is it appropriate to use a Z-test for one sample mean?
A) When the sample size is less than 30 and the population standard deviation is unknown
B) When the sample size is greater than or equal to 30 and the population standard deviation is known
C) When the sample size is less than 30 and the population standard deviation is known
D) When the data is non-normally distributed
Answer: B) When the sample size is greater than or equal to 30 and the population standard deviation is known
Explanation: The Z-test is used when the sample size is large (n ≥ 30) and the population standard deviation (SD) is known. It assumes that the sampling distribution of the sample mean is approximately normal due to the Central Limit Theorem (CLT).
3. How Do You Calculate the Test Statistic for a Z-Test?
Here’s where the math comes in!
Question: How do you calculate the test statistic for a Z-test for one sample mean?

Answer: A)
Explanation: The test statistic for a Z-test is calculated using the formula:
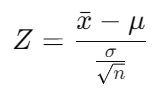
where x-bar is the sample mean, μ is the population mean, σ is the population standard deviation, and n is the sample size.
4. What is the Appropriate Test for Small Sample Sizes ( < 30) When Population SD is Known?
Small sample sizes require a different approach!
Question: Which test is appropriate for testing a sample mean when the sample size is less than 30 and the population standard deviation is known?
A) F-test
B) T-test
C) Chi-square test
D) Z-test
Answer: D) Z-test
Explanation: Even though the sample size is small, if the population standard deviation (SD) is known and the data is approximately normally distributed, a Z-test can still be used. However, if the sample size is small and the population SD is unknown, a T-test would be more appropriate.
5. When Should You Use a T-Test for One Sample Mean?
Understanding when to use a T-test is key!
Question: When is it appropriate to use a T-test for one sample mean?
A) When the sample size is large and the population standard deviation is known
B) When the sample size is small and the population standard deviation is unknown
C) When comparing variances of two samples
D) When the sample data is non-parametric
Answer: B) When the sample size is small and the population standard deviation is unknown
Explanation: A T-test is used when the sample size is less than 30 (small sample) and the population standard deviation is unknown. It uses the sample standard deviation as an estimate for the population standard deviation and is more conservative due to the smaller sample size.
6. How Do You Calculate the Test Statistic for a One-Sample T-Test?
Math time again!
Question: How do you calculate the test statistic for a one-sample T-test?

Answer: B)
Explanation: The test statistic for a one-sample T-test is calculated using the formula:
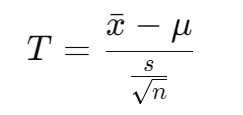
where x-bar is the sample mean, μ is the population mean, s is the sample standard deviation, and n is the sample size. This formula accounts for the fact that the sample standard deviation is only an estimate of the population standard deviation.
7. What is the Appropriate Test for Comparing Means of Two Independent Samples (Large Sample Size)?
Two samples? Let’s figure it out!
Question: Which test is appropriate for comparing the means of two independent samples when both samples are large (n ≥ 30) and the population standard deviations are known?
A) Two-sample T-test
B) Chi-square test
C) Paired T-test
D) Two-sample Z-test
Answer: D) Two-sample Z-test
Explanation: A Two-sample Z-test is appropriate when comparing the means of two independent samples that are large (n ≥ 30) and the population standard deviations are known. The test checks whether there is a significant difference between the means of the two populations.
8. How Do You Calculate the Test Statistic for a Two-Sample Z-Test?
Back to formulas!
Question: How do you calculate the test statistic for a two-sample Z-test?

Answer: A)
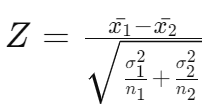
Explanation: The test statistic for a two-sample Z-test is calculated using the formula:


9. What is the Appropriate Test for Comparing Means of Two Independent Samples (Small Sample Size)?
Knowing which test to use is crucial!
Question: Which test is appropriate for comparing the means of two independent samples when both samples are small (n < 30) and the population standard deviations are known?
A) Two-sample T-test
B) Paired T-test.
C) Two-sample Z-test
D) Fisher’s Exact Test
Answer: C) Two-sample Z-test
Explanation: Even with a small sample size (n < 30), if the population standard deviations are known and the data is normally distributed, a Two-sample Z-test can still be used to compare the means of two independent samples. However, if the population standard deviations are unknown, a T-test would be more appropriate.
10. How Do You Calculate the Test Statistic for a Two-Sample T-Test When Population SD is Unknown?
Let’s get those formulas straight!
Question: How do you calculate the test statistic for a two-sample T-test when the population standard deviation is unknown?
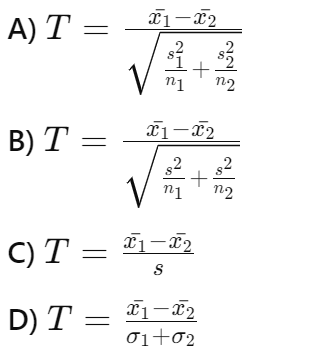
Answer: A)
Explanation: The test statistic for a two-sample T-test when the population standard deviations are unknown is calculated using:

11. When Would You Use a Paired T-Test?
Not all samples are independent!
Question: When is it appropriate to use a paired T-test?
A) When comparing means from two independent samples
B) When comparing variances of two samples.
C) When comparing means from the same group at two different times
D) When the data is non-parametric
Answer: C) When comparing means from the same group at two different times
Explanation: A Paired T-test is used when comparing two means from the same group at different times, or under two different conditions. For example, comparing students’ scores before and after a specific course. It accounts for the fact that the samples are related.
12. What is the Assumption of Normality in Hypothesis Testing?
Let’s talk assumptions!
Question: What does the assumption of normality imply in hypothesis testing for means?
A) The population distribution is skewed
B) The sample distribution is skewed
C) The sampling distribution of the sample mean is approximately normal
D) The sample size is always less than 30
Answer: C) The sampling distribution of the sample mean is approximately normal
Explanation: The assumption of normality in hypothesis testing for means implies that the sampling distribution of the sample mean is approximately normal. This assumption is crucial, especially for small sample sizes, as it affects the validity of the test results.
13. How Do You Interpret the Results of a Hypothesis Test for a Mean?
Understanding your results is key!
Question: After conducting a hypothesis test for a mean, what does it mean if you reject the null hypothesis?
A) There is sufficient evidence to suggest the sample mean is significantly different from the population mean
B) There is insufficient evidence to suggest the sample mean is significantly different from the population mean
C) The sample mean equals the population mean
D) The sample mean has no relation to the population mean
Answer: A) There is sufficient evidence to suggest the sample mean is significantly different from the population mean
Explanation: If you reject the null hypothesis, it means that the sample provides sufficient evidence to conclude that the sample mean is significantly different from the population mean at the chosen level of significance.
14. What is the Impact of Sample Size on Hypothesis Testing for Means?
Size matters in statistics too!
Question: How does increasing the sample size affect hypothesis testing for means?
A) It increases the power of the test
B) It decreases the power of the test
C) It increases the standard error of the mean
D) It makes the test statistic less reliable
Answer: A) It increases the power of the test
Explanation: Increasing the sample size reduces the standard error of the mean, which in turn increases the power of the test. This means that the test is more likely to detect a true effect when it exists, making the results more reliable.
15. What is the Effect of a High Confidence Level on Hypothesis Testing?
Let’s wrap it up with confidence!
Question: What is the effect of using a high confidence level (e.g., 99%) in hypothesis testing?
A) It increases the likelihood of a Type I error
B) It decreases the likelihood of a Type I error
C) It has no effect on the likelihood of a Type I error
D) It decreases the sample size required
Answer: B) It decreases the likelihood of a Type I error
Explanation: A higher confidence level means a lower alpha (significance level), which decreases the likelihood of making a Type I error (falsely rejecting a true null hypothesis). However, this also makes the test more conservative, potentially increasing the likelihood of a Type II error (failing to reject a false null hypothesis).
Conclusion of Part 2
There you have it!
By understanding the different scenarios for hypothesis testing — whether it’s a large or small sample size, known or unknown population standard deviation — you are now well-prepared to handle any interview question on this topic.
Hypothesis testing is a critical tool in a data scientist’s arsenal, helping you make data-driven decisions with confidence. Keep practicing these questions, stay curious, and good luck with your data science journey!
Feel free to share this blog with fellow aspiring data scientists or statistics students, and drop any questions or comments below.
Connect with me:
- On LinkedIn.
- Career Counselling and Mentorship: Topmate
- Join my Whatsapp Group where I share resources, links, and updates.
Let’s keep learning together! 😊
Comments
Post a Comment