Whether you’re prepping for your next data science interview or just brushing up on core statistics concepts, this guide is your go-to cheat sheet.
We’re diving into 10 essential questions that recruiters love — and candidates often fumble.
No jargon. Just clear explanations, practical examples, and real-world relevance.
1. What is the Central Limit Theorem (CLT), and Why Should You Care?
The Central Limit Theorem states that the sampling distribution of the sample mean becomes approximately normal as the sample size increases — even if the original population is skewed.
📌 Formula (for the sampling distribution of the mean):
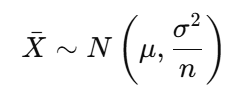
- μ: population mean
- σ²: population variance
- n: sample size
Example:
Imagine drawing repeated samples of size 30 from a skewed population. If you compute the mean of each sample and plot the distribution of these means, it will resemble a normal distribution.
👉 This is the math behind why confidence intervals and hypothesis testing work!
2. Explain P-Value and What It Actually Tells Us
The P-value is the probability of obtaining results at least as extreme as the observed ones, assuming the null hypothesis is true.
Interpretation:
- p < 0.05: Reject the null hypothesis — statistically significant.
- p≥0.05: Do not reject the null — could be due to chance.
Example:
A clinical trial yields a p-value of 0.02. That means there’s a 2% chance that the observed effect (or more extreme) could occur under the assumption that the treatment has no effect.
🚨 Pro tip: A low p-value doesn’t mean the result is important, just unlikely under the null.
3. What Do Confidence Intervals Represent?
A confidence interval provides a range of plausible values for a population parameter, based on sample data.
Formula (for mean, known σ):

Example:
You compute a 95% confidence interval for average daily screen time as [4.8, 5.2] hours.
Interpretation: If you repeated the study 100 times, 95 of those intervals would capture the true mean.
🔎 Wider intervals = more uncertainty!
Tighter intervals = more confidence in precision!
4. What’s the Difference Between Type I and Type II Errors?

Real-life example:
In fraud detection:
- Type I: Flagging a legit transaction as fraud.
- Type II: Letting a fraud slip through.
🎯 Trade-offs between these errors depend on the context.
5. Explain the Law of Large Numbers with an Example
The Law of Large Numbers says that as the number of trials increases, the sample mean gets closer to the true population mean.
Example:
Flip a fair coin 10 times — you might get 7 heads.
Flip it 10,000 times — you’ll approach 50% heads.
This principle powers A/B testing, polling, and statistical estimates. But remember: Large datasets can still be misleading if biased.
6. When Should You Use Mean, Median, or Mode?
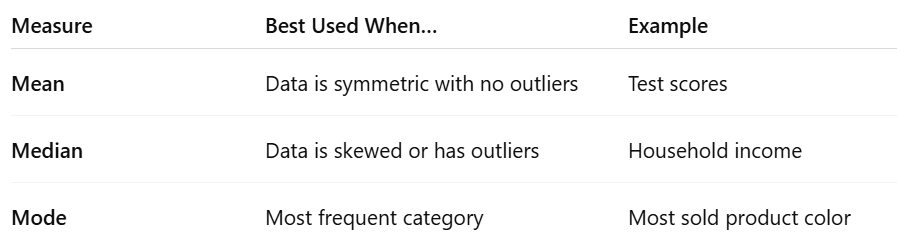
📌 Example:
Data: [10, 12, 12, 12, 15, 17, 90]
- Mean = 24.57 (inflated by 90)
- Median = 12
- Mode = 12
👉 Choose based on the shape and purpose of your analysis.
7. Give a Real-Life Use Case of Hypothesis Testing
Scenario: You’re a Product Manager testing if a new app layout improves engagement.
- Null hypothesis (H₀): No difference in click-through rate (CTR)
- Alternative (H₁): New layout improves CTR
- P-value = 0.03
✅ Since 0.03 < 0.05, reject the null — the new layout likely increases engagement.
🎯 Applications:
- A/B testing
- Drug effectiveness trials
- Manufacturing quality checks
8. Bayes’ Theorem: What Is It and Why Does It Matter?
Bayes’ Theorem updates the probability of a hypothesis as more evidence becomes available.

Real Example:
- 1% of population has a disease
- Test has 99% sensitivity and 95% specificity
- You test positive. What’s the probability you actually have the disease?
🧠 Answer: It’s not 99%! You must apply Bayes’ rule to factor in base rate.
Applications:
- Spam filtering
- Medical diagnostics
- ML classifiers
9. What is Sampling Bias and How Can You Spot It?
Sampling bias occurs when your sample isn’t representative of the population.
Examples of bias sources:
- Only surveying people online (excludes the offline population)
- Voluntary response bias (only passionate people respond)
✅ How to detect it?
- Ask who’s missing
- Check sample demographics
- Compare with the full population
📌 Bias kills trust. Garbage in, garbage out.
10. Which Probability Distributions Should Data Scientists Know?
Some essential distributions:

🧠 Know their shapes, formulas, and when to apply them.
Conclusion
These 10 questions are interview classics — but they’re also everyday tools in data science.
Don’t just memorize definitions — understand them, practice with real data, and always think: How does this apply in the real world?
Thanks for reading the blog. Hope you delivered some value out of this blog.
- On LinkedIn.
- Career Counselling and Mentorship: Topmate
- Join my Whatsapp Group where I share resources, links, and updates.
Comments
Post a Comment