Probability is at the core of data science, statistics, and machine learning.
Whether you’re analyzing data, making predictions, or building models, probability helps you understand uncertainty and make better decisions.

In this guide, we'll discuss the most important probability concepts that every aspiring statistician or data scientist should master.
We’ll also cover mathematical formulas and solved examples to help you understand these concepts better.
Let’s dive in!
1. Probability: The Foundation of It All
Probability is simply the likelihood of an event happening.
Whether you’re flipping a coin or picking a card from a deck, the fundamental concept remains the same.
Formula:

Example:
What’s the probability of getting heads when flipping a coin?

So, you’ve got a 50% chance of landing heads. It will remain the same even if you flip it again because, let’s face it, we all want a “best of three” sometimes.
2. Conditional Probability: When Events Depend on Each Other
Conditional probability refers to the probability of an event occurring given that another event has already happened.
It’s like saying, “What are the chances it will rain tomorrow if the forecast today says it’s likely?”
Formula:

Example:
Suppose 30% of people in a café drink coffee, and 10% drink coffee and eat cake. What’s the probability that someone eats cake, given that they’re drinking coffee?
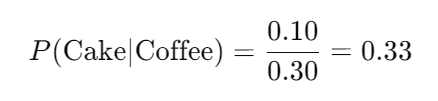
So, there’s a 33% chance that coffee drinkers also enjoy a slice of cake. (Honestly, who doesn’t?)
3. The Law of Total Probability: Combining Multiple Events
This law helps you figure out the overall probability when there are several ways for an event to occur.
It’s super useful when events can happen through multiple scenarios.
Formula:

Example:
Imagine you have two bags. Bag A contains 5 red balls and 5 blue balls, and Bag B contains 3 red balls and 7 blue balls. If you randomly pick a ball from one of the bags, what’s the probability that it’s red?

There’s a 40% chance of picking a red ball.
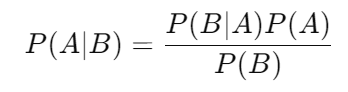
4. Bayes’ Theorem
Bayes’ Theorem is a way of updating probabilities when new evidence or information comes in.
Depending on the quality of new information — whether its factual or rumor — the result may improve or deteriorate.
It’s fundamental in machine learning and decision-making under uncertainty.
Formula:
Example:
Suppose 1% of a population has a rare disease, and a test for the disease is 99% accurate for positive cases and 95% accurate for negative cases. What’s the probability someone has the disease if they test positive?

This is interesying, isn’t it?. Even if someone gets a positive test, there’s only a 16.6% chance that he/she actually has the disease, due to the rarity of the disease in the population.
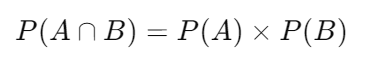
5. Independent and Dependent Events
Two events are independent if the outcome of one doesn’t affect the other.
Dependent events, on the other hand, are like dominos — when one falls, it influences the other.
Formula for Independent Events:
Example:
If you roll a die and flip a coin, the probability of rolling a 6 and flipping heads is:

Since rolling a die and flipping a coin are independent, the outcomes don’t affect each other.
6. Mutually Exclusive Events
No Double Dipping
In simple terms, these are events when two things can’t happen at the same time. Like you can’t both win and lose a game — you have to pick one.
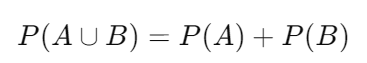
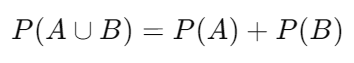
Formula:
Example:
What’s the probability of rolling a 3 or a 5 on a die?
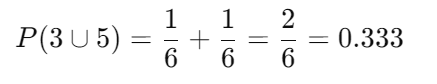
So, a 33% chance you’ll roll either a 3 or a 5. Simple enough!
7. Complementary Events
When It’s One or the Other
Complementary events are like toss of a fair coin — if head happens, tail doesn’t.
Formula:

Example:
If the probability of rolling a 6 is 1/6, what’s the probability of not rolling a 6?

So, you have a 5 in 6 chance of not rolling a 6. It’s not as bad as it sounds.
8. Additive Probability Rule
The additive rule is when you’re dealing with mutually exclusive events — only one can happen.
Example (Additive Rule):
What’s the probability of rolling either a 4 or a 5 on a die?

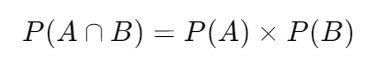
9. Multiplicative Probability Rule
The multiplicative rule is for independent events — those events that can happen at the same time.
Multiplicative Rule Formula (Independent Events):
Example:
What’s the probability of rolling a 6 on a die and flipping heads on a coin?

10. Mathematical Expectation
The expected value is a key concept in probability, representing the average outcome of a random variable over many trials. It helps you determine what you can expect on average if you perform an experiment (or process) repeatedly.
Formula:

In simpler terms, the expected value is the sum of each possible outcome multiplied by its probability.
Example: You roll a fair six-sided die. What’s the expected value of the outcome?
Each outcome (1 through 6) has a probability of 1/6.

This comes out to be 3.5
So, the expected value of a die roll is 3.5. While you can’t actually roll a 3.5, this is the average outcome over many rolls.
Concluding thoughts!
Probability forms the backbone of many data science tasks — from predicting customer behavior to building machine learning models.
Mastering these essential concepts will help you approach data with confidence and improve your ability to draw meaningful insights.
- On LinkedIn.
- Career Counselling and Mentorship: Topmate
- Join my Whatsapp Group where I share resources, links, and updates.
Comments
Post a Comment