The concepts we’ll test and discuss in this article are the backbone of probability distributions.
For aspiring data scientists and data analysts, mastering probability distributions is super useful.
Understanding how random variables behave, calculating expected values, and differentiating between various types of distributions are all essential skills for analyzing data and building predictive models.
By grasping these foundational ideas, you’ll be better equipped to tackle complex problems in data science interviews and excel in your career.
Test Your Knowledge
Below are 15 multiple-choice questions designed to test your understanding of probability distributions.
Take a moment to work through each question, writing down your answers in a notepad.
Lets start!
1. What is a Random Variable?
a) A variable that takes deterministic values.
b) A variable that always takes integer values.
c) A constant that never changes.
d) A variable that assigns numerical values to the outcomes of a random process.
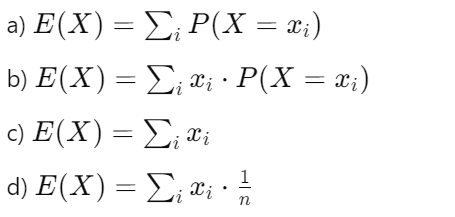
2. What is the Expected Value of a Discrete Random Variable?
3. What is the expected value of rolling a fair six-sided die?
a) 3.5
b) 4
c) 3
d) 2.5
4. What Defines a Probability Distribution?
a) A method to calculate the mean.
b) A list of all possible outcomes.
c) A function that assigns probabilities to all possible outcomes of a random variable.
d) None of the above.
5. Which of the following is a characteristic of a discrete random variable?
a) It can take any value within a range.
b) It has a finite or countable number of possible outcomes.
c) Its probability is defined by a probability density function.
d) It always takes a value of 0 or 1.
6. Which of the following is true for a probability mass function (PMF)?
a) It applies to continuous random variables.
b) The sum of all probabilities can exceed 1.
c) It gives the probability that a discrete random variable is exactly equal to some value.
d) It is used to find the variance of a distribution.
7. If a random variable X has the PMF: P(X = 1) = 0.2, P(X = 2) = 0.5, and P(X = 3) = 0.3, what is the probability that X is 2?
a) 0.3
b) 0.5
c) 0.7
d) 0.2
8. A continuous probability distribution is described by:
a) A list of discrete probabilities.
b) A table of outcomes.
c) A histogram.
d) A probability density function (PDF)
9. Which of the following is an example of a continuous probability distribution?
a) Binomial distribution
b) Poisson distribution
c) Normal distribution
d) Geometric distribution
10. In a normal distribution, what is the probability of a random variable exactly equaling the mean?
a) 0
b) 0.5
c) 1
d) Depends on the standard deviation
11. Which of the following statements about mathematical expectation is correct?
a) It is always equal to the mode.
b) It is the average or mean value expected from an experiment.
c) It is only applicable to continuous distributions.
d) It represents the variance of the distribution.
12. If P(X = 0) = 0.2, P(X = 1) = 0.3, P(X = 2) = 0.5, what is the expected value of X?
a) 1
b) 1.2
c) 1.5
d) 1.3
13. If the expected value E(X) of a random variable X is 2, and E(X²) = 6, what is the variance Var(X)?
a) 2
b) 4
c) 6
d) 0
14. What does the cumulative distribution function (CDF) of a random variable represent?
a) The probability of the random variable taking a specific value.
b) The probability that the random variable is less than or equal to a specific value.
c) The expected value of the random variable.
d) The variance of the random variable.
15. Which of the following is a key difference between continuous and discrete probability distributions?
a) Continuous distributions have a finite number of possible outcomes.
b) Discrete distributions can only take decimal values.
c) Continuous distributions assign probabilities to intervals rather than specific values.
d) Discrete distributions are described by probability density functions.
Solutions and Explanations
Now that you’ve worked through the questions, let’s go over the correct answers with explanations.
1. Answer: d) A variable that assigns numerical values to the outcomes of a random process.
Explanation: A random variable maps outcomes of a random experiment to numerical values.
2. Answer: b)

Explanation: The expected value is the sum of each possible value multiplied by its corresponding probability.
3. Answer: a) 3.5
Explanation: Expected value calculation: (E(X) = (1 + 2 + 3 + 4 + 5 + 6)/ 6 = 3.5.
4. Answer: c) A function that assigns probabilities to all possible outcomes of a random variable.
Explanation: A probability distribution describes how the values of a random variable are distributed.
5. Answer: b) It has a finite or countable number of possible outcomes.
Explanation: Discrete random variables have specific, countable outcomes.
6. Answer: c) It gives the probability that a discrete random variable is exactly equal to some value.
Explanation: PMF applies to discrete variables and ensures the sum of all probabilities equals 1.
7. Answer: b) 0.5
Explanation: The probability P(X = 2) is given directly as 0.5.
8. Answer: d) A probability density function (PDF).
Explanation: A continuous probability distribution uses a PDF to describe the likelihood of a random variable within a range.
9. Answer: c) Normal distribution
Explanation: The normal distribution is a continuous distribution defined by its mean and standard deviation.
10. Answer: a) 0
Explanation: In a continuous distribution, the probability of any specific value is 0. Probabilities are defined over intervals.
11. Answer: b) It is the average or mean value expected from an experiment.
Explanation: The mathematical expectation is the average value expected from a random variable.
12. Answer: d) 1.3
Explanation: Expected value calculation: E(X) = 0 x 0.2 + 1 x 0.3 + 2 x 0.5 = 1.5).
13. Answer: a) 2
Explanation: Variance calculation: Var(X) = E(X²) — [E(X)]² = 6–2² = 2.
14. Answer: b) The probability that the random variable is less than or equal to a specific value.
Explanation: The CDF represents the cumulative probability up to a certain value.
15. Answer: c) Continuous distributions assign probabilities to intervals rather than specific values.
Explanation: In continuous distributions, probabilities are assigned to ranges, not individual points.
Scoring and Rating
Now that you’ve completed the quiz, let’s see how you did!
- If you answered 13–15 questions correctly: Excellent! You have a strong grasp of probability distributions. Keep up the great work!
- If you answered 10–12 questions correctly: Well done! You have a solid understanding, but a bit more review will make you even stronger.
- If you answered 7–9 questions correctly: Not bad, but you might want to revisit some of the concepts to strengthen your knowledge.
- If you answered fewer than 7 questions correctly: Don’t worry! Use this as an opportunity to review the material and improve.
Understanding probability distributions is a key skill for any data scientist or analyst, and by mastering these concepts, you’ll be well-prepared for any interview questions or academic tests. Keep practicing, and you’ll continue to grow your expertise in this important area!
If you are interested in building your competencies in analytics, data science, machine learning, please check out the following blogs as well.
If you’re as passionate about AI, ML, DS, Strategy and Business Planning as I am, I invite you to:
Connect with me:
- On LinkedIn.
- Career Counselling and Mentorship: Topmate
- Join my Whatsapp Group where I share resources, links, and updates.
Comments
Post a Comment