Complete Guide to Sampling Methods: Random, Stratified, Systematic, and Cluster Sampling with Python Examples
A step-by-step guide to sampling methods: random, stratified, systematic, and cluster sampling explained with Python implementation. Perfect for data science learning.

In the world of data science, statistics, and analytics, it’s often impossible to collect data from the entire population.
That’s where sampling methods come to the rescue — helping us pick a smaller group that still represents the whole.
In this blog, we’ll break down four major sampling techniques:
- Random Sampling
- Stratified Sampling
- Systematic Sampling
- Cluster Sampling
We’ll also show you how to implement them step-by-step in Python using the famous Titanic dataset!
What is Sampling?
Sampling is simply selecting a subset of individuals from a larger population, so we can study and make conclusions about the entire group without examining every individual.
A good sampling method ensures that your sample is representative, unbiased, and accurate.
1. Simple Random Sampling
Every individual has an equal chance of being selected. It’s like drawing names out of a hat — pure luck, no bias.
Simple Random Sampling is used when you want a straightforward and fair representation of the entire population.
Formula
There is no complex formula — every item has equal probability:

Where:
- n = sample size
- N = total population size
Simple Example
Suppose there are 100 passengers on Titanic, and you randomly pick 10 passengers. Each passenger has a 10/ 100=10% chance of being selected.
Python Implementation (Titanic Dataset)
import seaborn as sns
import pandas as pd
# Load Titanic dataset
titanic = sns.load_dataset('titanic')
# Drop missing age values for simplicity
titanic = titanic.dropna(subset=['age'])
# Random sampling: Select 10% of the dataset randomly
random_sample = titanic.sample(frac=0.10, random_state=30)
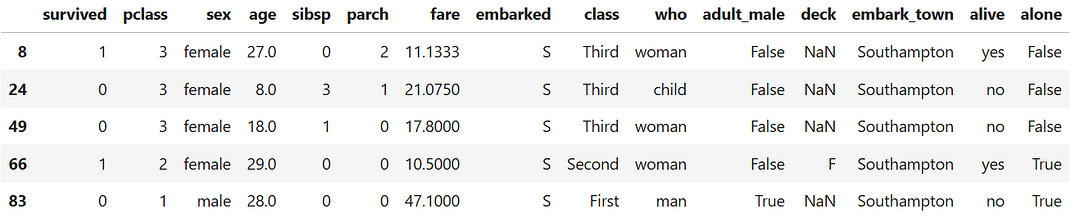
print(random_sample.head())Output
A random selection of about 10% of the passengers.

2. Stratified Sampling
Concept
In stratified sampling, the population is divided into groups (strata) based on an important characteristic (like gender), and then samples are drawn proportionally from each group.
This ensures your sample respects the structure of the population.
Formula
Sampling from each stratum:
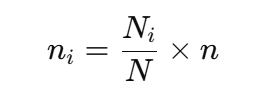
Where:
- Ni = size of stratum ii
- N = total population size
- n = total sample size
Simple Example
Suppose on Titanic, 70% passengers are male and 30% are female.
If you want a sample of 100 passengers, you should pick 70 males and 30 females.
Python Implementation (Stratified by Gender)
from sklearn.model_selection import train_test_split

# Drop missing 'sex' values
titanic = titanic.dropna(subset=['sex'])

# Stratified sampling: maintain the same male/female ratio
stratified_sample, _ = train_test_split(titanic,
                                        stratify=titanic['sex'],
                                        test_size=0.8,
                                        random_state=42)

print(stratified_sample['sex'].value_counts(normalize=True))

print(titanic['sex'].value_counts(normalize=True))
Output
The gender proportion (male vs female) in the sample will match the original dataset.

3. Systematic Sampling
Concept
In systematic sampling, you select every k-th item from an ordered list.
It’s simple, fast, and effective when your data is organized.
Formula
First, calculate the sampling interval k:

Where:
- N = total population size
- n = desired sample size
Simple Example
If there are 500 Titanic passengers and you want 50 samples, you pick every 10th passenger after a random starting point.
Python Implementation (Selecting Every k-th Passenger)
import numpy as np

# Set sample size
n = 50
N = titanic.shape[0]
k = N // n

# Random starting point
start = np.random.randint(0, k)

# Systematic sampling
systematic_sample = titanic.iloc[start::k]
print(systematic_sample.head())
Output
A sample of passengers selected at regular intervals.
4. Cluster Sampling
Concept
In cluster sampling, instead of picking individuals, you randomly select entire groups (clusters) and survey everyone within the selected groups.
Formula
No complex formula needed:
- Divide the population into clusters.
- Randomly pick clusters.
- Survey everyone from selected clusters.
Simple Example
Suppose the Titanic passengers are divided into cabins (A, B, C, D…), and you randomly pick cabins B and C and survey everyone from those cabins.
Python Implementation (Clusters by Passenger Class)
Let’s treat ‘class’ (First, Second, Third) as clusters.
# Check unique clusters
print(titanic['class'].unique())

# Randomly select 1 passenger class
selected_clusters = np.random.choice(titanic['class'].unique(), size=1, replace=False)

# Select all passengers from selected cluster
cluster_sample = titanic[titanic['class'].isin(selected_clusters)]

print(f"Selected Cluster: {selected_clusters[0]}")
print(cluster_sample.head())
Output
All passengers from, say, Second class, selected as your sample.

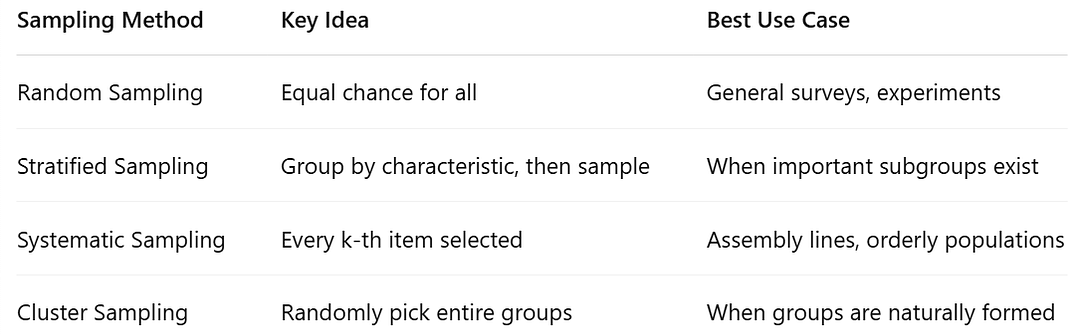
Quick Summary Table
Final Words
Choosing the right sampling method is crucial for reliable results:
- Need fairness? Choose Random Sampling.
- Need subgroup representation? Pick Stratified Sampling.
- Want a simple structured approach? Go with Systematic Sampling.
- Need quick access to large groups? Cluster Sampling is perfect.
By mastering these techniques — and knowing how to code them in Python — you’ll be better prepared for real-world data science and analytics projects.
Enjoyed this journey? Request you to please hit that clap button and share it with someone who’s interested in Sampling, Statistics, Market Research and Data science!
Connect with me:
- On LinkedIn.
- Career Counselling and Mentorship: Topmate
- Join my Whatsapp Group where I share resources, links, and updates.
Collection of my other blogs can be found here.
Happy Learning!
Comments
Post a Comment