Credit Risk and Statistical Distributions

Scenario
Imagine you’re a data scientist at a lending institution, and you’ve been asked to understand and predict certain events, like the likelihood of loan defaults or the frequency of inquiries a borrower makes in a given period.
This is where statistical distributions, like the Binomial and Poisson distributions, come into play.
Steps:
- Load and Explore the Loan Dataset
- Understand the Binomial Distribution
- Implementing the Binomial Distribution in Python
- Understand the Poisson Distribution
- Implementing the Poisson Distribution in Python
Step 1: Load and Explore the Loan Dataset
Start by loading the dataset and taking a quick exploratory glance.
import pandas as pd

# Load the dataset
loans_data = pd.read_csv('loansdata.csv')

# Check the first few rows of the dataset
loans_data.head()
Output:

Understand the Data
The original data used in this exercise comes from publicly available data from LendingClub.com, a website that connects borrowers and investors over the Internet.
There are 14 variables used in the data, and a brief data dictionary is provided below:

For this article, we’ll be focusing on some of these variables to explain the Binomial and Poisson distributions.
Step 2: Understanding the Binomial Distribution
The Binomial distribution represents the number of successes in a fixed number of independent trials, where each trial has only two possible outcomes (like success or failure).
Mathematical Equation
The probability mass function (PMF) for a Binomial distribution is:
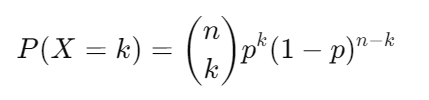
In the above equation,
- the binomial coefficient represents the number of ways to choose `k` successes out of `n` trials.

- The second term (p^k) is the probability of having k successes.
- The third term ((1−p)^(n−k)) is the probability of having (n−k) failures.
Step 3: Implementing the Binomial Distribution in Python
Good, the theory is behind us. Let’s take a sample case and learn how to perform binomial distribution in Python.
For example, in our loan data, we can model the probability of a borrower defaulting on a loan.
To do this, let’s first find out the probability of default. Remember, not.fully.paid represents the variable denoting default or not.
loans_data['not.fully.paid'].value_counts()Output:

Out of 9578 records, there are 1533 default cases. So the probability of default comes out to be 16%.
Let’s say we want to model the probability of exactly 3 out of 10 borrowers defaulting on their loans.
So, n = 10, p = 0.16 (calculated above), and k =3. The Python code to implement this is below.
from scipy.stats import binom

# Define the parameters

# number of trials (borrowers)
n = 10

# probability of default
p = 0.16

# Calculate the probability of exactly 3 defaults
k = 3

binom_prob = binom.pmf(k, n, p)
print(f"Probability of exactly {k} out of {n} borrowers defaulting: {binom_prob:.4f}")
Output:

So the answer is 0.145. So what’s happening in the above code is that the first line imports the binom module from the scipy.stats library.
Then we set the parameters and finally the binom.pmf function computes the probability mass function (PMF) for the Binomial distribution.
This tells us how likely it is to see exactly 3 borrowers default out of 10.
Step 4: Understanding the Poisson Distribution
The Poisson distribution is a way to understand how often an event occurs within a specific period of time or a certain area.
It’s especially useful when you’re dealing with rare events, like the number of car accidents at a particular intersection in a month.
Unlike the Binomial distribution, which has a set number of attempts (like flipping a coin 10 times), the Poisson distribution doesn’t require a fixed number of trials.
Instead, it focuses on the rate of occurrence. This rare phenomenon also means that the probability of the event happening in any tiny interval is small, but the distribution tells us about the number of times the event could happen in the larger interval (like a day, a week, etc.).
Mathematical Equation
The probability mass function (PMF) for a Binomial distribution is:
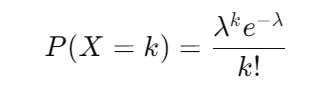
In the above equation,
- `λ` is the average rate of occurrence.
- `e` is the base of the natural logarithm (approximately 2.71828).
- `k` is the number of occurrences.
Step 5. Implementing the Poisson Distribution in Python
Suppose we want to model the number of inquiries a borrower makes in the last 6 months. If the average number of inquiries is known, we can use the Poisson distribution to predict the probability of a borrower making exactly say 4 inquiries.
The average rate (mean) of inquiries is calculated for the data with the following code:
loans_data['inq.last.6mths'].mean()With the value of `λ` calculated, let’s use Poisson distribution to calculate the probability of exactly 4 inquiries.
from scipy.stats import poisson

# Define the parameter
lambda_ = loans_data['inq.last.6mths'].mean()

# Calculate the probability of exactly 4 inquiries
k = 4
poisson_prob = poisson.pmf(k, lambda_)
print(f"Probability of exactly {k} inquiries in the last 6 months: {poisson_prob:.4f}")
Output:

In the code above, `poisson.pmf(k, lambda_)` calculates the probability mass function (PMF) for exactly `k` inquiries when the average rate of inquiries is `lambda_`.
Conclusion
By using real-world loan data, we’ve explored how the Binomial and Poisson distributions can be applied in the financial sector.
These distributions are not just great theoretical concepts to boost about, they’re powerful tools that help several organizations manage risk and make informed decisions.
If you’re as passionate about AI, ML, DS, Strategy and Business Planning as I am, I invite you to:
Connect with me:
- On LinkedIn.
- Career Counselling and Mentorship: Topmate
- Join my Whatsapp Group where I share resources, links, and updates.
#DataScience, #PythonProgramming, #ProbabilityDistributions, #LoanAnalytics, #StatisticalAnalysis
Comments
Post a Comment